


Road to Malware Analyst Part 3 - Debuggers
Easy Mode

Hello all.
Welcome to part 3 of the Malware Analyst Autist Guidebook.
Today, we will be discussing debuggers: what they are and how they’re used. Debuggers make our lives easier, so if you were able to handle the static analysis posts, you should get this no problem.
Dynamic Analysis
When you are using a debugger, you are executing the program that you are analyzing. This is called dynamic analysis. The main difference between static and dynamic analysis is whether or not you are executing the program. Pretty straightforward, right?
The purpose of debugging is to slowly march your way along a program’s logical flow in order to understand how it works and to inspect changes in memory values. This is, of course, much easier than staring at assembly code and trying to deduce behavior.
Beyond just “it’s easier”, why else would you use a debugger? Often times, malware is obfuscated in some way. There are dozens of obfuscation techniques such as packing, dynamic stringifying, even anti-debugger/anti-VM code.
Let’s take packing or dynamic strings for example. Let’s say you have been given a malware sample. Your first-instinct triage would be tossing it into a Portable Executable viewer (like PeStudio) to inspect suspicious imports and strings. If the strings all appear to be gobbledegook (or has high entropy), this malware may be packed or have some sort of dynamic method for filling strings. I recall some sort of C++ compiler with a name I can’t remember that, for every declared literal string, created a unique function for dynamically creating and filling the string buffer.
I probably should have discussed triaging in a previous post before diving into static and dynamic analysis. Perhaps next post.
So, if you are debugging a program, you can inspect the memory locations of strings (and other data types) and see how they are changed as you step through the program.
Debugger Features
Breakpoints
Breakpoints are points in which the program will halt execution. This is useful for inspecting dangerous malware.
Let’s say you have a copy of a ransomware program that you want to analyze. You obviously don’t want to encrypt your files (you better be doing this in a VM, anon!), so you would first statically analyze the program, decide where a good stopping point would be, and set a breakpoint at the instruction’s location.
Once the program reaches that instruction point. It will halt and you can inspect the stack, registers, and segment memory.
There are 2 types of breakpoints, and I will touch on them briefly.
Software breakpoints
Debuggers place replace the byte where you want the breakpoint to be with a signatory byte that tells the debugger to halt.
Software breakpoints are flexible and can be used across multiple different architectures
Malware can place these bytes manually in attempt to thwart analysts, so beware!
Hardware breakpoints
x86 has a hardware breakpoint instruction set (DR0-DR7) which can assist with anti-VM malware. You can only have 4 hardware breakpoints at a time, however. Plus, hardware breakpoints vary between architectures.
Stepping
You can step across a program instruction by instruction. This is useful for slowly inspecting how the program logically flows and viewing how values can iteratively change in the program.
“Stepping Over” moves you into the next instruction and executes it. If the next instruction is a function, then the function executes and the line after the function call will be the halted position.
“Stepping Into” moves you into the next instruction and executes it. If the next instruction is a function, it jumps into the function’s code space and halts at the first instruction.
Hands-On Debugging
Let’s take a look at some malware that I’ve written, it is a very simple keylogger. You can grab a copy of it on my Tor site here.
I’m about to spoil what it does, so if you want to try and analyze it on your own first, give it a try. I will use IDA’s local debugger because I’ve used it the most often. x64dbg and OllyDbg are nice free alternatives.

Some quick static analysis shows that it creates a socket connection and then iteratively sends keystrokes. Let’s see if we can figure out the IP address of where these keystrokes are going.
Socket connections are a form of network communication between different machines. Think of how a socket works in real life. You plug it in so that electricity flows through it. Network sockets behave similar. You “plug in” 2 machines so that they can communicate.
To spoil some behavior, we know that:
The program opens a socket connection (to an obfuscated IP).
The program captures keystrokes every 10 milliseconds.
The program sends an std::string of the keystrokes to the socket server.
The program never exits (i.e. while true loop).
So, how would we where the program is sending this information? It is a dynamically allocated string which is filled by dynamically received values. This is where we would abuse breakpoints.
With Windows library functions, many, if not all, are not stripped (i.e. not names named “sub_*”). To connect to a remote server, you need an IP address, obviously. This is where inet_addr comes into play. This converts an IP string into the proper unsigned long type.
Now, you can tell that the string used in that function is not a string literal. It is a dynamically allocated string, which cannot feasibly be identified with strictly static analysis. In this example, the obfuscation is a simple XOR operation, but it could get crazy with iterations and iterations of bit rolling (RORs and ROLs), which can make your head spin.
So, in this situation. We set a breakpoint on the connect function so that 1: we stop the program right before it connects to some random IP address, and 2: we can view the IP address that it is going to connect to.
See the blue dots on the left? If we click that, it sets a breakpoint where the program will halt upon reaching that instruction.

Let’s start the debugger. Note that the program will exit if the listener server is not running. See the README in the zip.
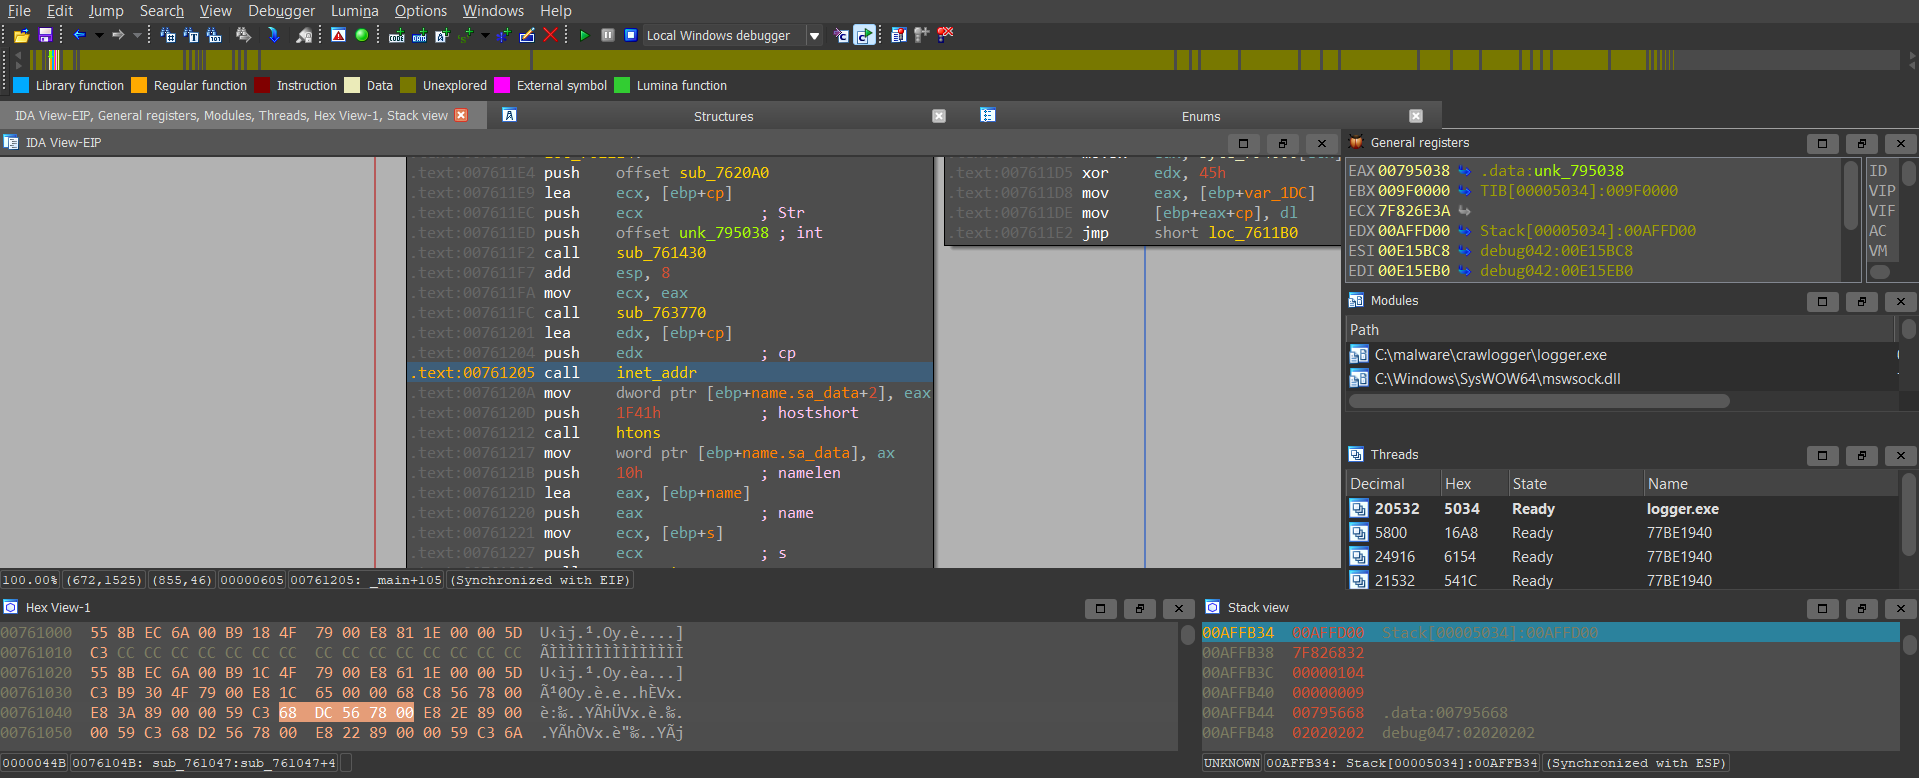
This is our debugger view. It’s a bit chaotic at first glance, but we have everything that we need to inspect the program.
We have the view of the currently running instructions (top left)
Registers and their values (top right)
Imports and created threads (mid right)
Hex (bottom left)
Stack (bottom right)
Pop quiz. If I allocate a string, where does it go in memory?
The stack. Good job. You knew that from last post right? Right???
One more. You can see that the string is being passed as an argument to the inet_addr function. So, what register is the string in?
EDX, good.
Let’s simply just grab the string from EDX. If you double click the EDX register on the IDA View, it will jump you to the stack section, where you will see…

… the IP address! 127.0.0.1.
You could also click the arrow under the register tab.

Or grab the value from the stack by double clicking the stack value provided by IDA (cp)

There’s more than one way to skin this cat.
When you want to get back to the original IDA View, click on the blue arrow EIP in the register tab. You know why, right?
When debugging this program, it won’t work properly (log your keystrokes) which is unfortunate. If you run it manually, you should see a log.txt with your keystrokes in the same folder as listener.py. (Be sure to end the logger.exe task when you’re finished with it if you are running it manually.)
That’s it for now. I’m still working on getting all of my crap on my Tor site for everyone to play around with. As always, my Twitter DMs are open for questions and concerns. Thanks for reading.